Paragon Automation 2.0 Lab
Welcome to the hands-on lab!
Overview
Lab Objective
The objective of this Lab is to:
Get hands of experience of Paragon Automation 2.x family.
Perform Active Assurance Tests and Monitors using Templates and Observability of test results.
Execute various Assurance Use-Cases from Activation Testing to Performance Monitoring.
Execute scripts to demonstrate seamless integration with third party applications by using REST APIs.
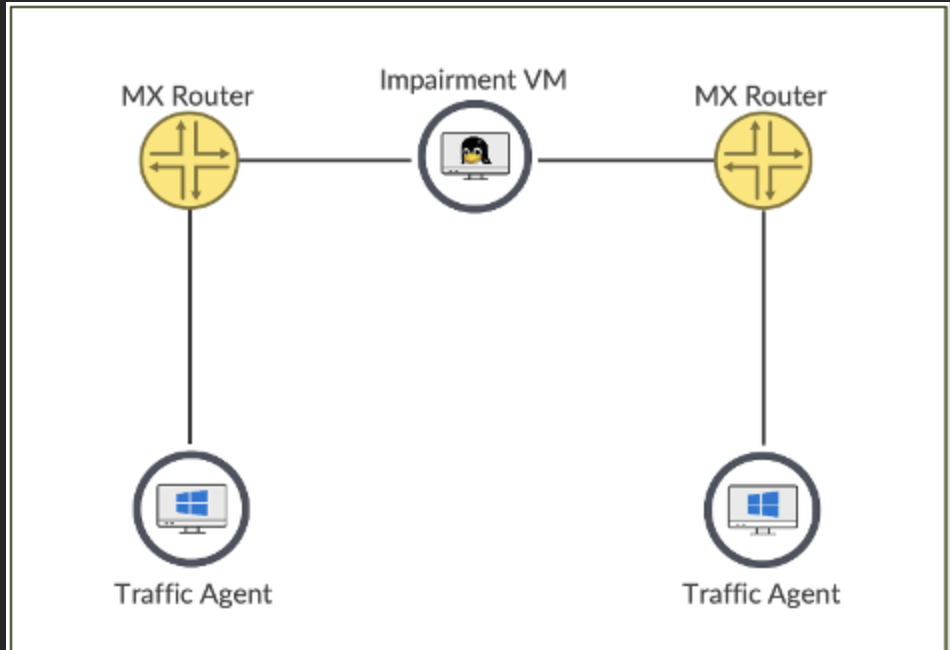
Topology
Consists of a pair of MX204 or MX304 connected via an Impairment vm with Paragon Automation Test Agent Application running VM’s to send traffic streams.
Lab Steps
Test 1 – Reachability: Test Ping, DNS.
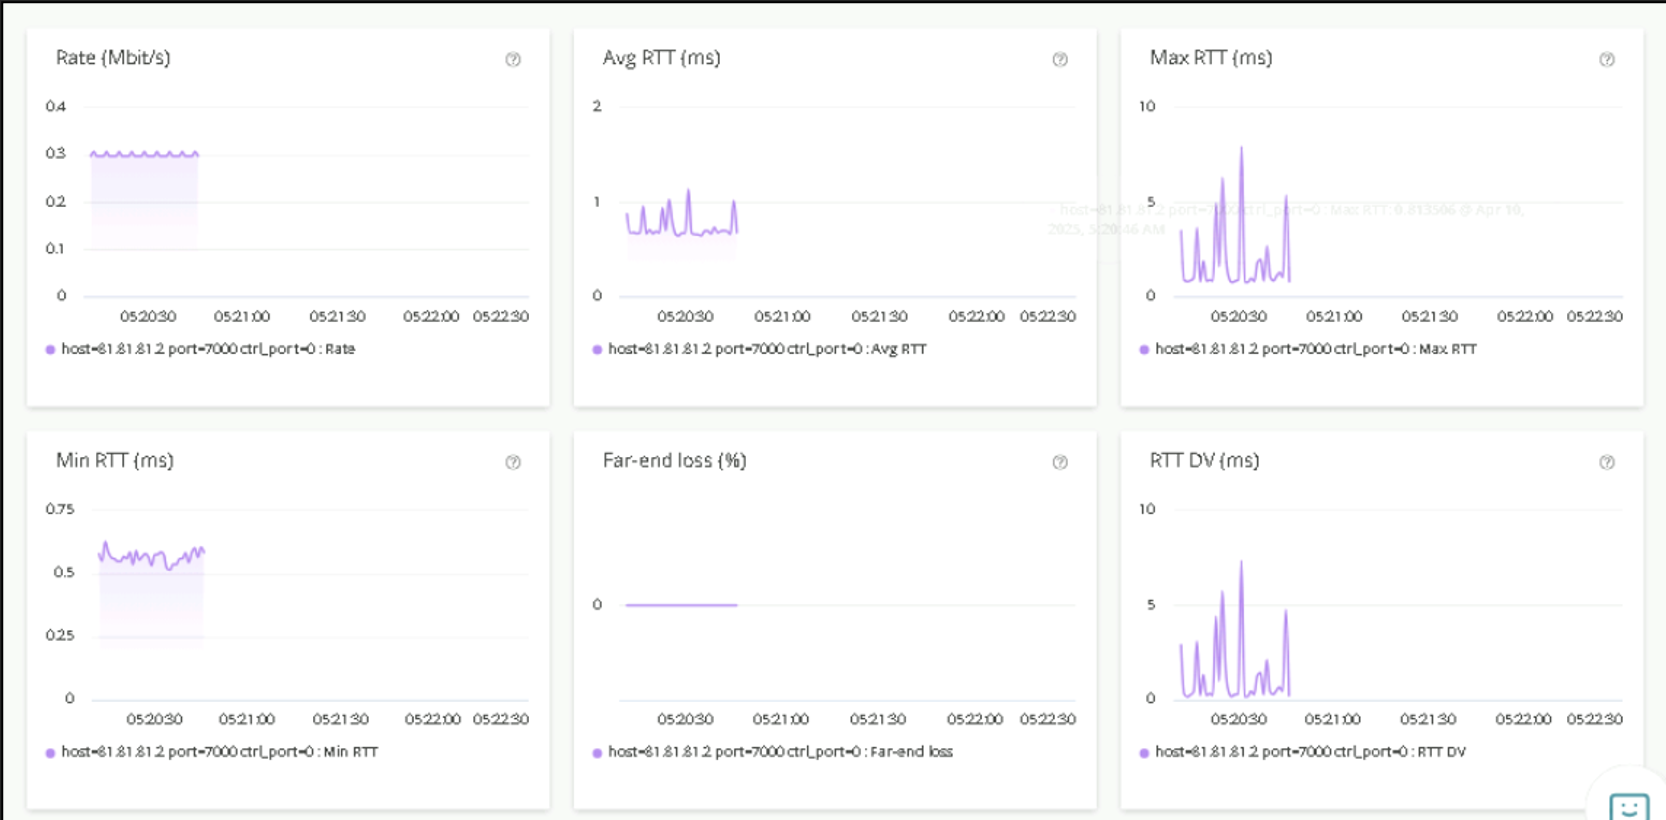
Once the network or service is activated, we can test and check if its functioning at optimal level by observing the KPI’s like delay, jitter, loss.
Test 2 – Cloud Apps Reachability: Test Ping and Access to Cloud Apps (AWS, Azure, GCP etc.)
Test 3 & 4 – Performance Monitoring: Periodic Synthetic traffic to assure network or service is at optimal level without impact to revenue traffic by observing the KPI’s.
Login to Paragon
Login to Paragon portal.
Open Chrome browser and navigate to https://100.123.42.100
You should see the login page to Paragon Automation UI.
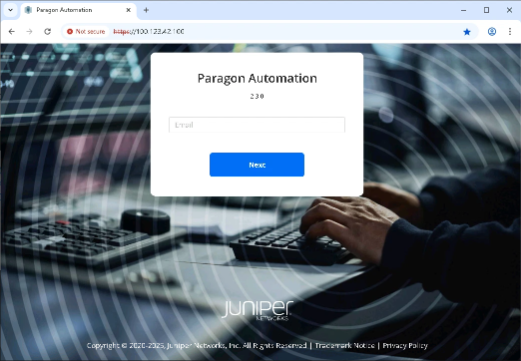
Login using following credentials
Username: jcluser@juniper.net
Password: Juniper!1
Navigate to the pre-configured Test Templates
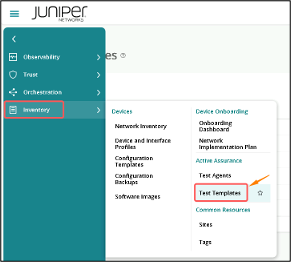
Click on Inventory > Test Templates
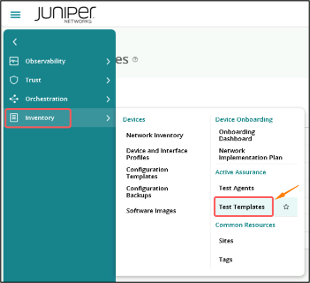
This page will show all the pre-configured Templates that we’ll be using for Test.
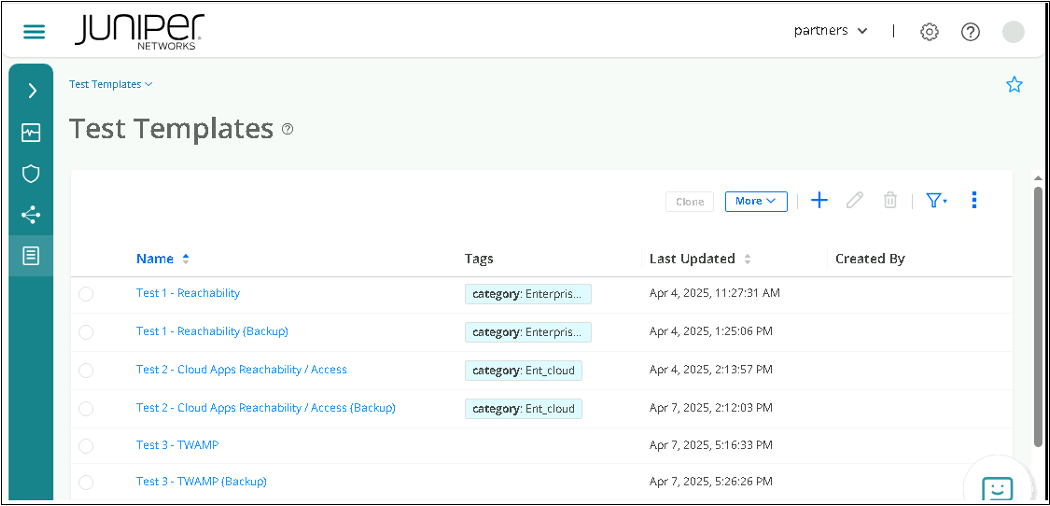
<List the Tests available for HOL and 1 liner no need to go detail>
Test1 – Reachability – Test DNS, Ping – Once the network or service is built activate this network and be assured that the network or service is functioning at optimal level by way of observing the KPI’s like delay , jitter, loss
Test2 – Not only networking and reachability but also service reachability
Test 3, 4 – Performance Monitoring – periodic Synthetic traffic to assure network or service is at optimal level without impact to revenue traffic by observing the KPI’s
Test 1 – Reachability
In this test we’ll check the reachability between Branches and Branch to Internet.
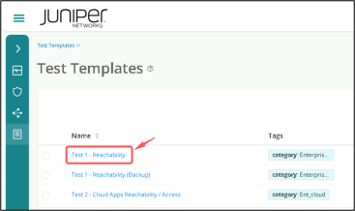
Go to Test Templates page and Click on Test 1 – Reachability
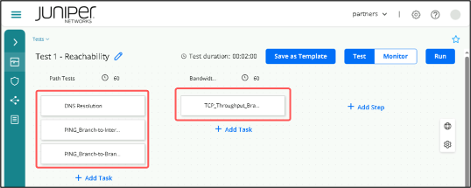
The test is further divided into Sub tasks.
Task 1.1: DNS Resolution
This test will try to resolve google.com
Task 1.2: Ping from Branch to Internet
This test will do a PING from the Branch to the Internet (Google).
Task 1.3: Ping from Branch to Branch
This test will do a PING from one Branch to another Branch
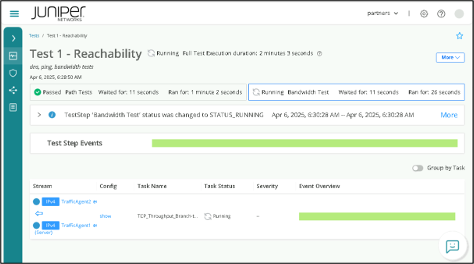
Task 2.1: TCP throughput from Branch to Branch
This test will perform a Bandwidth test from one Branch LAN to another Branch LAN
Test execution
Click on Run to execute the tests.
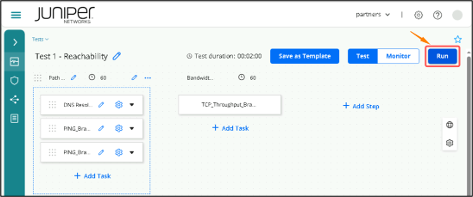
All the tests will run in sequence; Task 1.1 > Task 1.2 > Task 1.3 > Task 2.1
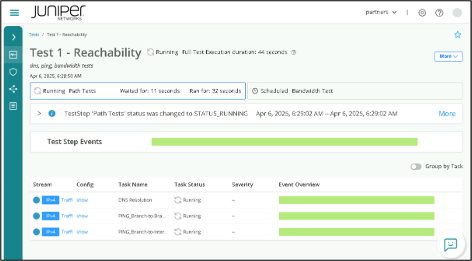
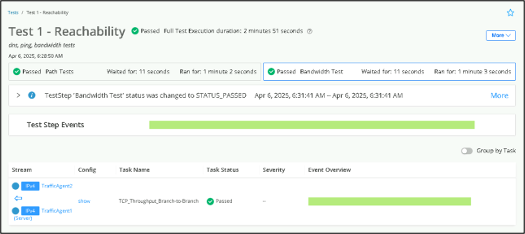
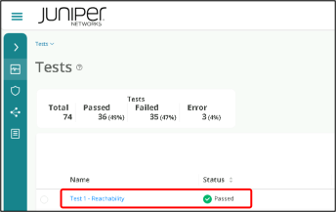
Once all the tests are completed, we can check the Task Status to see whether the tests are Passed or Failed
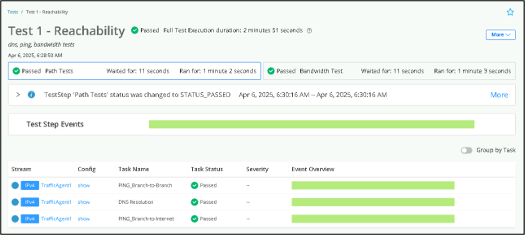
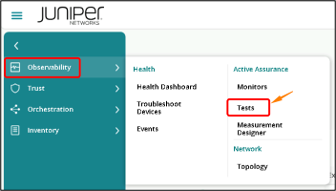
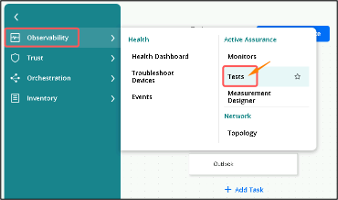
You can also go to Tests page and check the Status of particular Test. Click on Observability > Tests
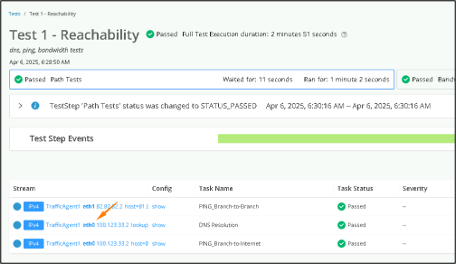
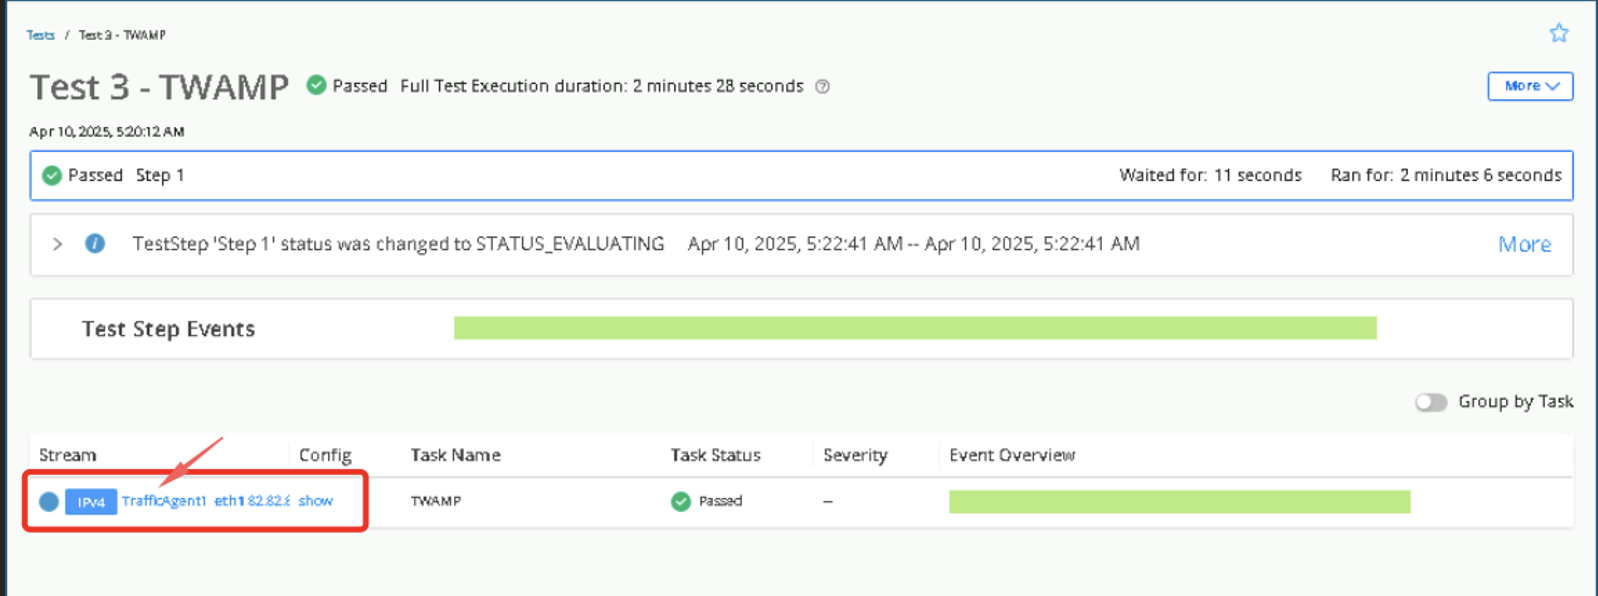
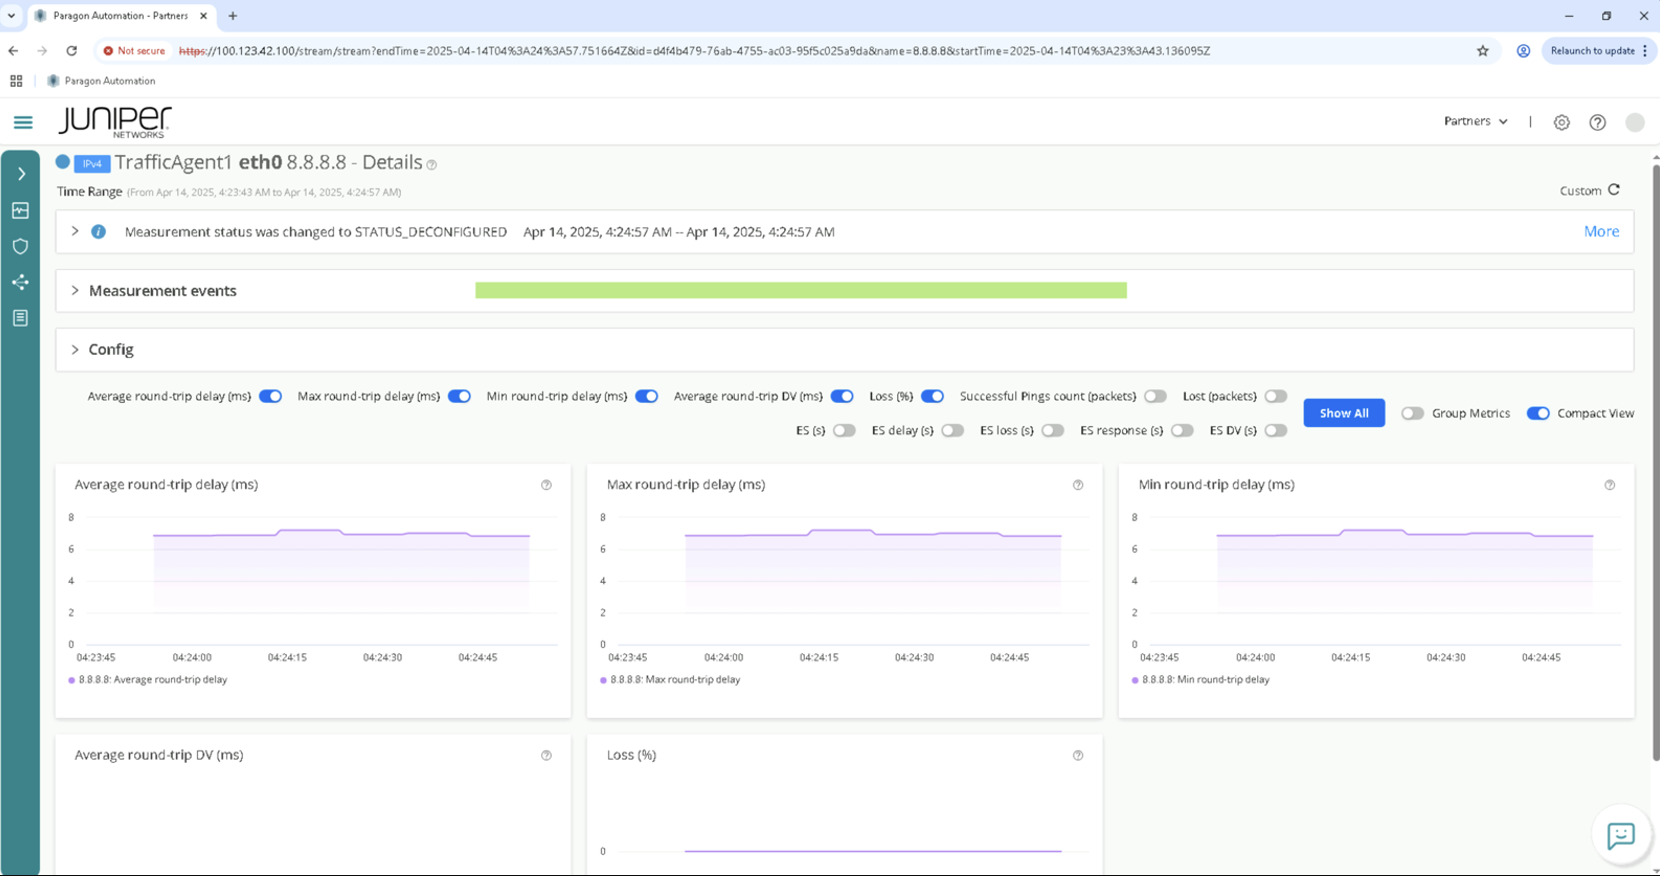
To check more details of any test. Click on a particular Stream
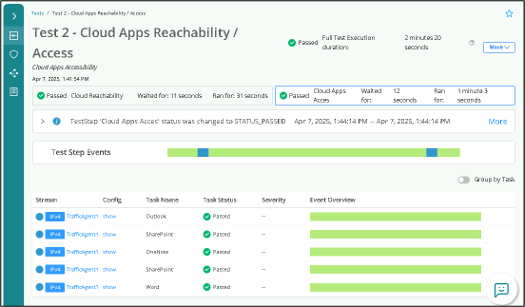
Test 2 – Cloud Apps Reachability
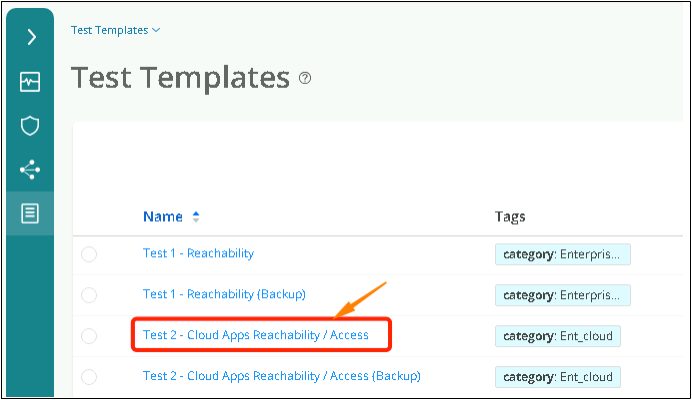
Navigate to Inventory > Test Templates
Click on Test 2 – Cloud Apps Reachability / Access
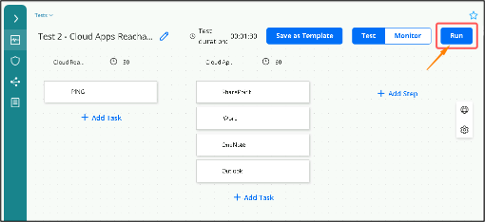
Click on Run to execute the test.
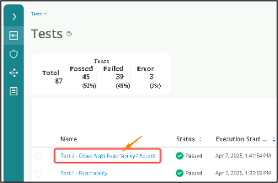
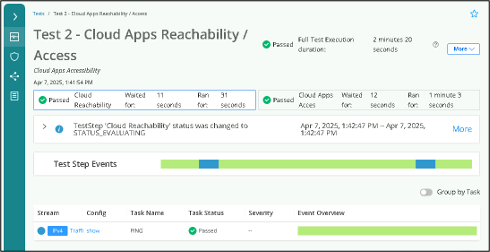
Go to Tests page to check the status.

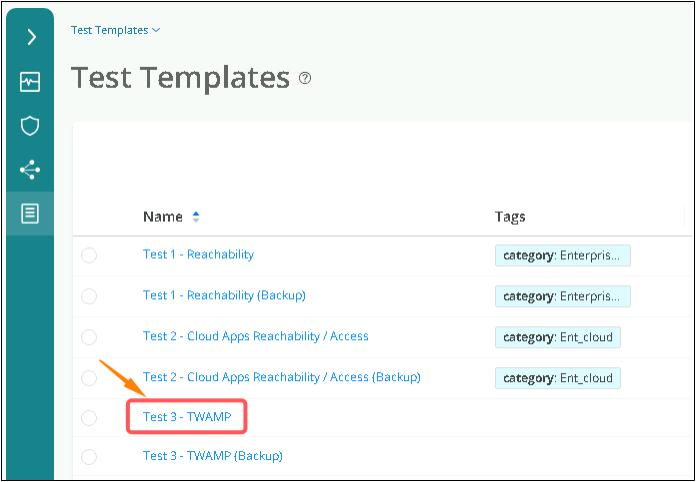
Test 3 - TWAMP (Two-Way Active Measurement Protocol)
Navigate to Inventory > Test Templates

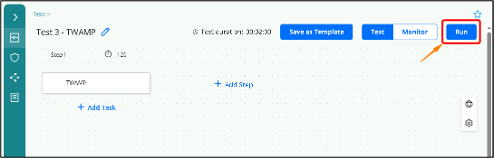
Click on Test 3 – TWAMP
Click on Run to execute the test.
Go to Tests page to check the status.
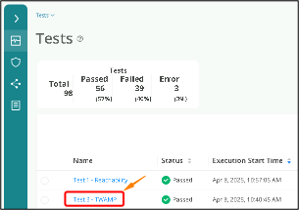
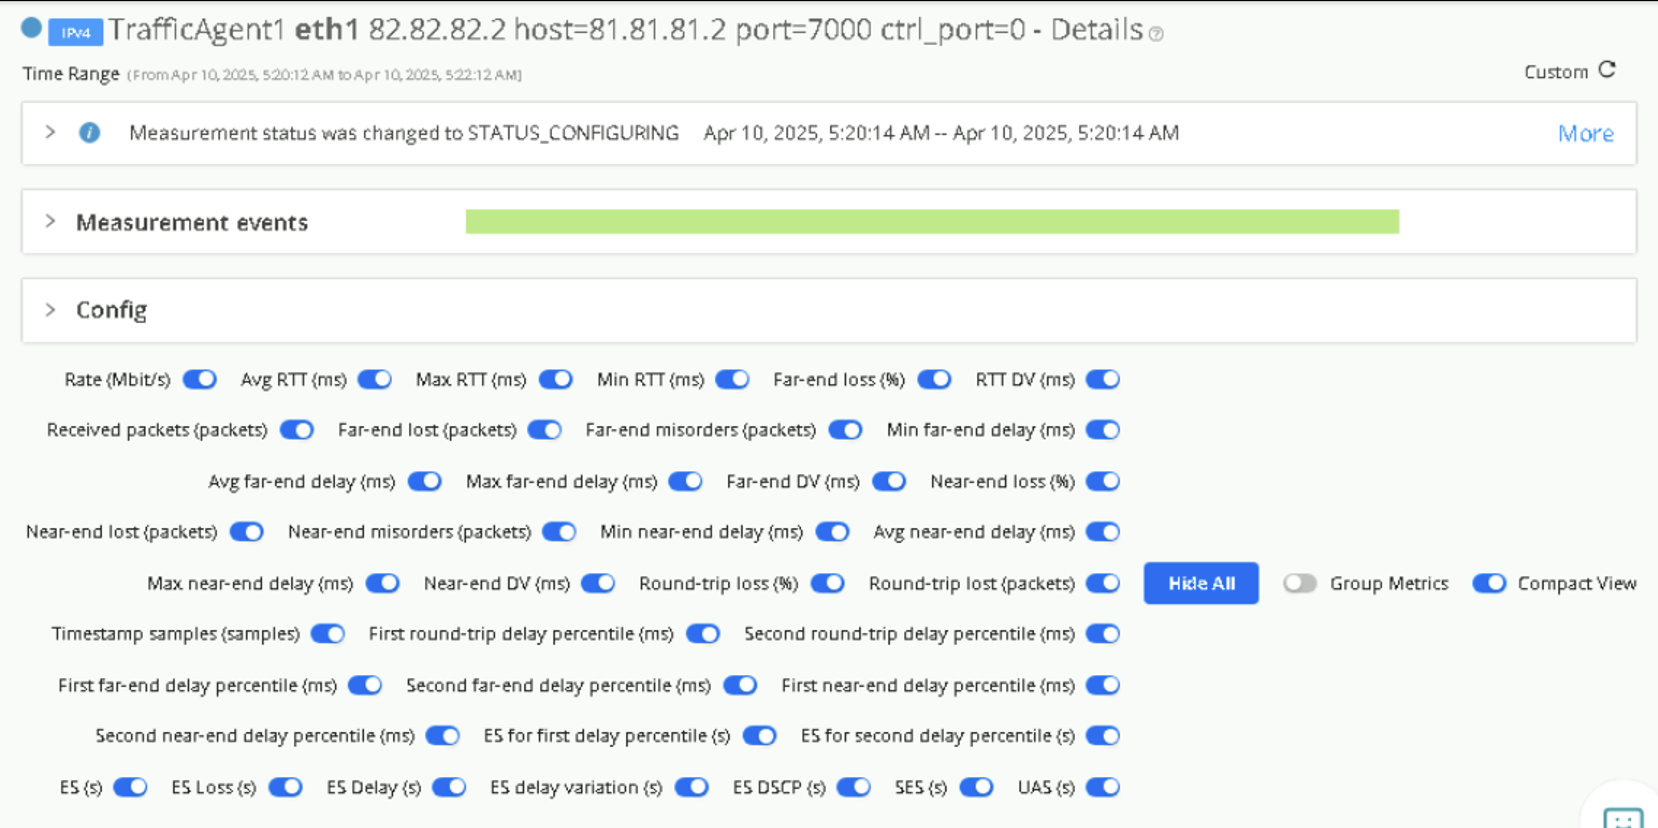
Click on the Stream to get detailed result.
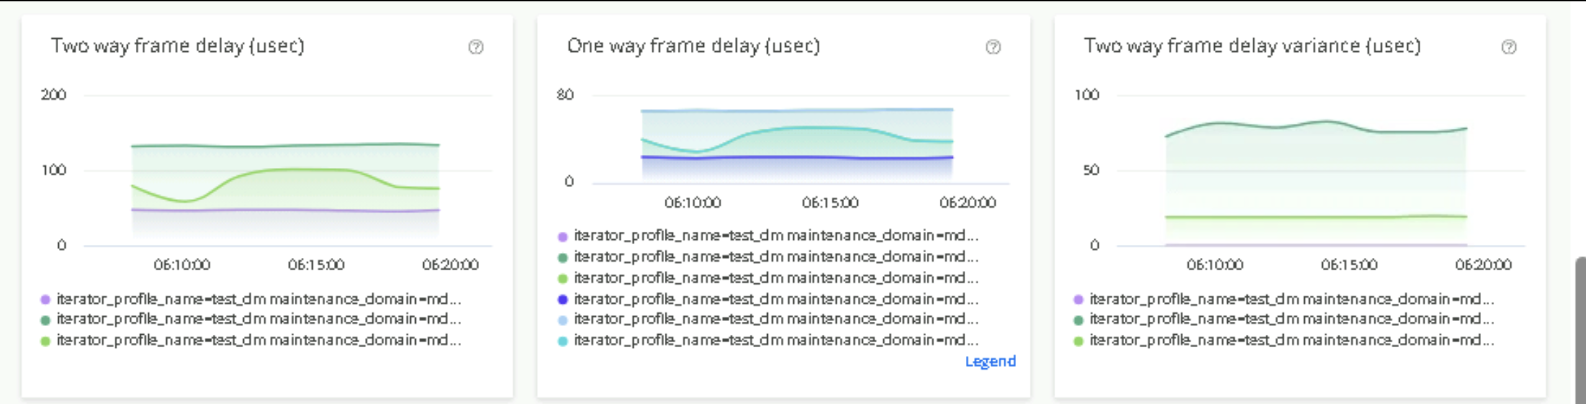
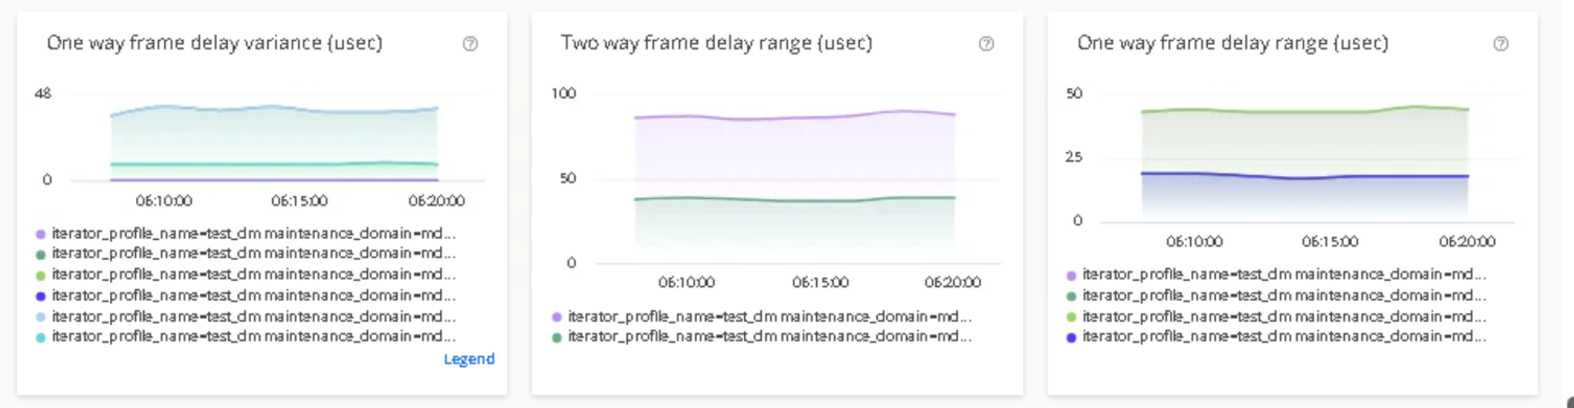
Test 4 - Y.1731
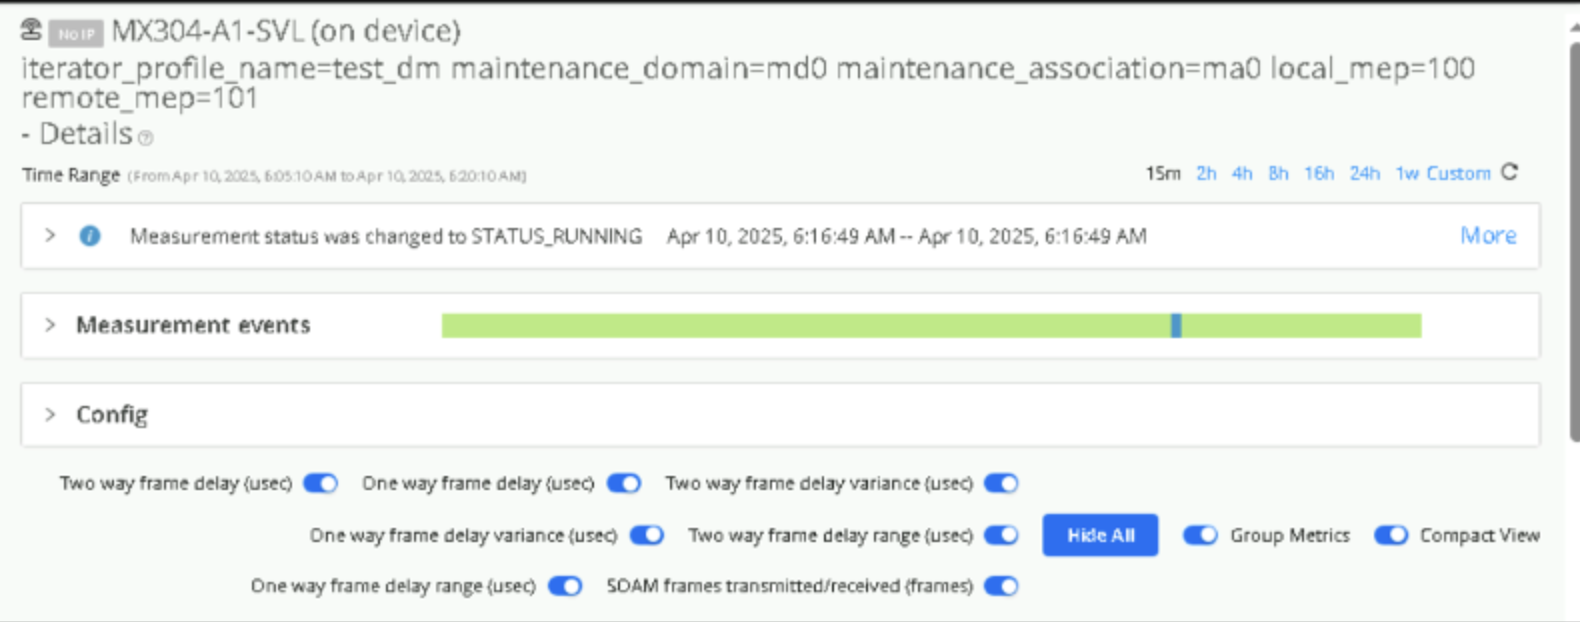
Y.1731 testing basically measures loss, delay, and delay variation (jitter) for traffic from the Test Agent towards a Y.1731-capable device.
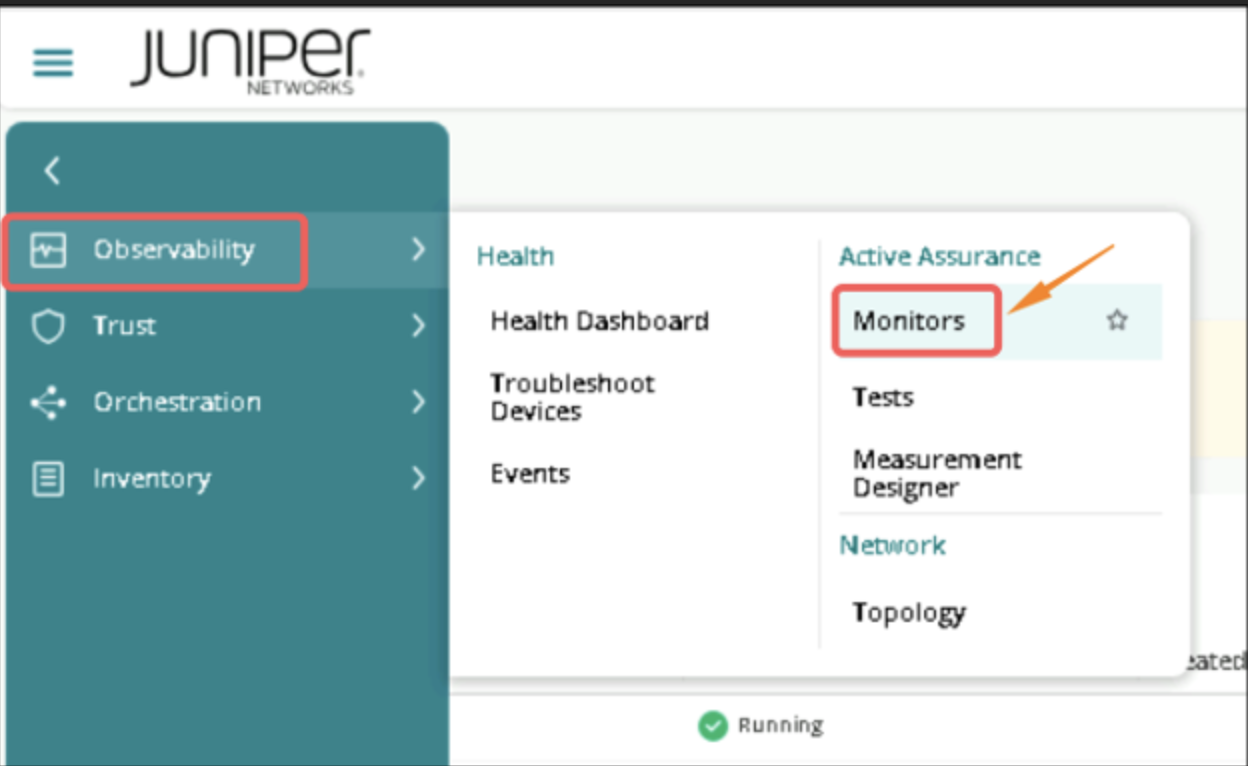
Click on Observability > Monitors
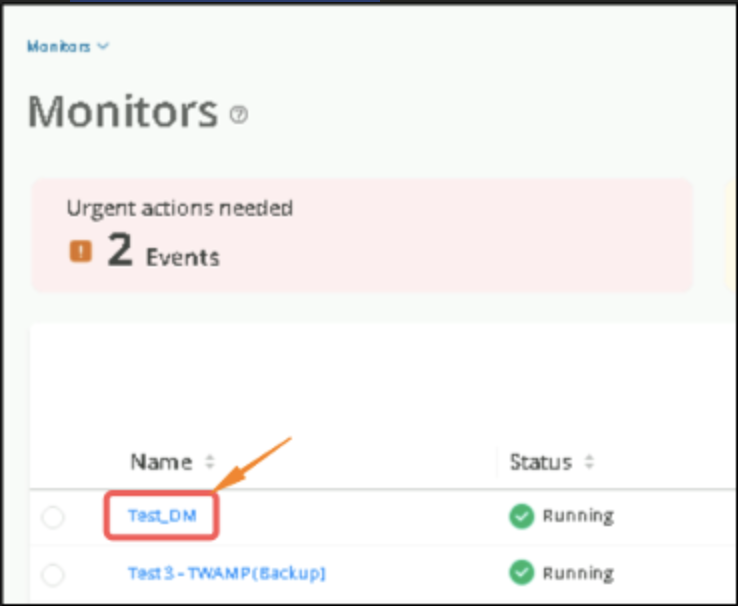
Click on Test_DM
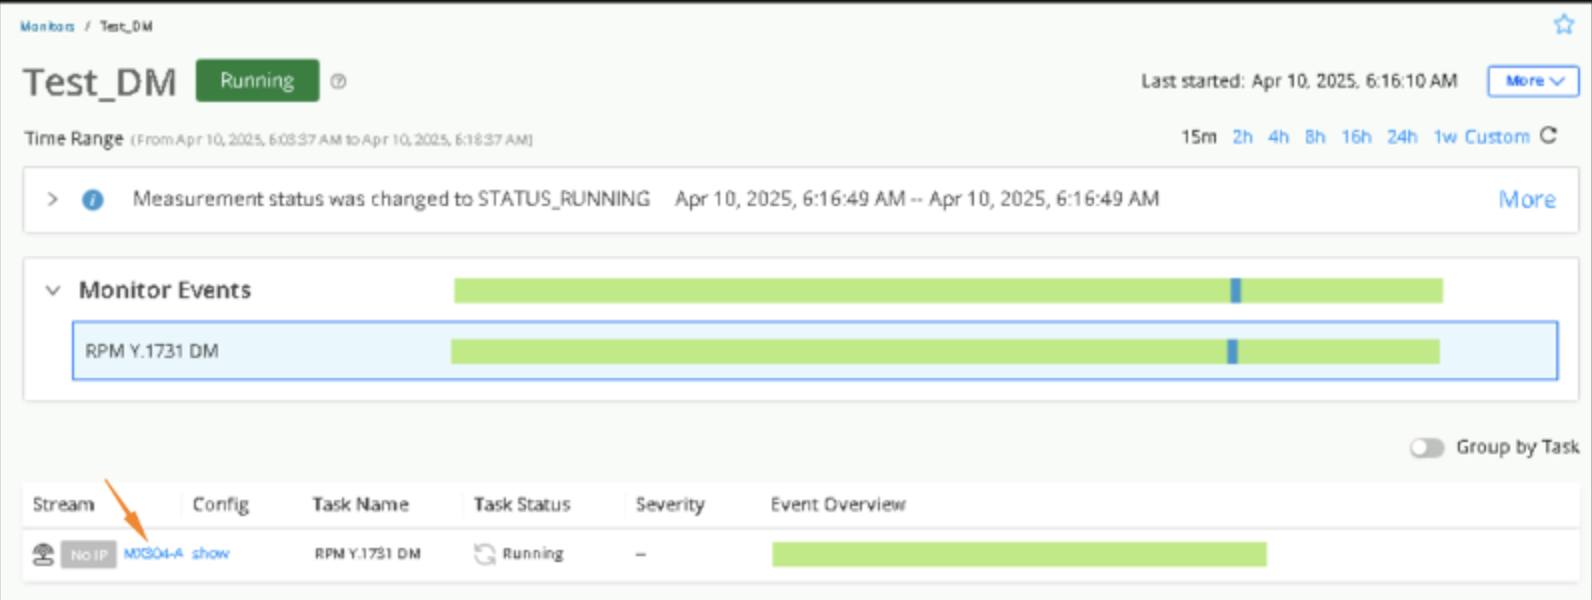
Click on the Stream
Monitoring the Results
Test 5 - Execution of REST API based Tests from Helper VM
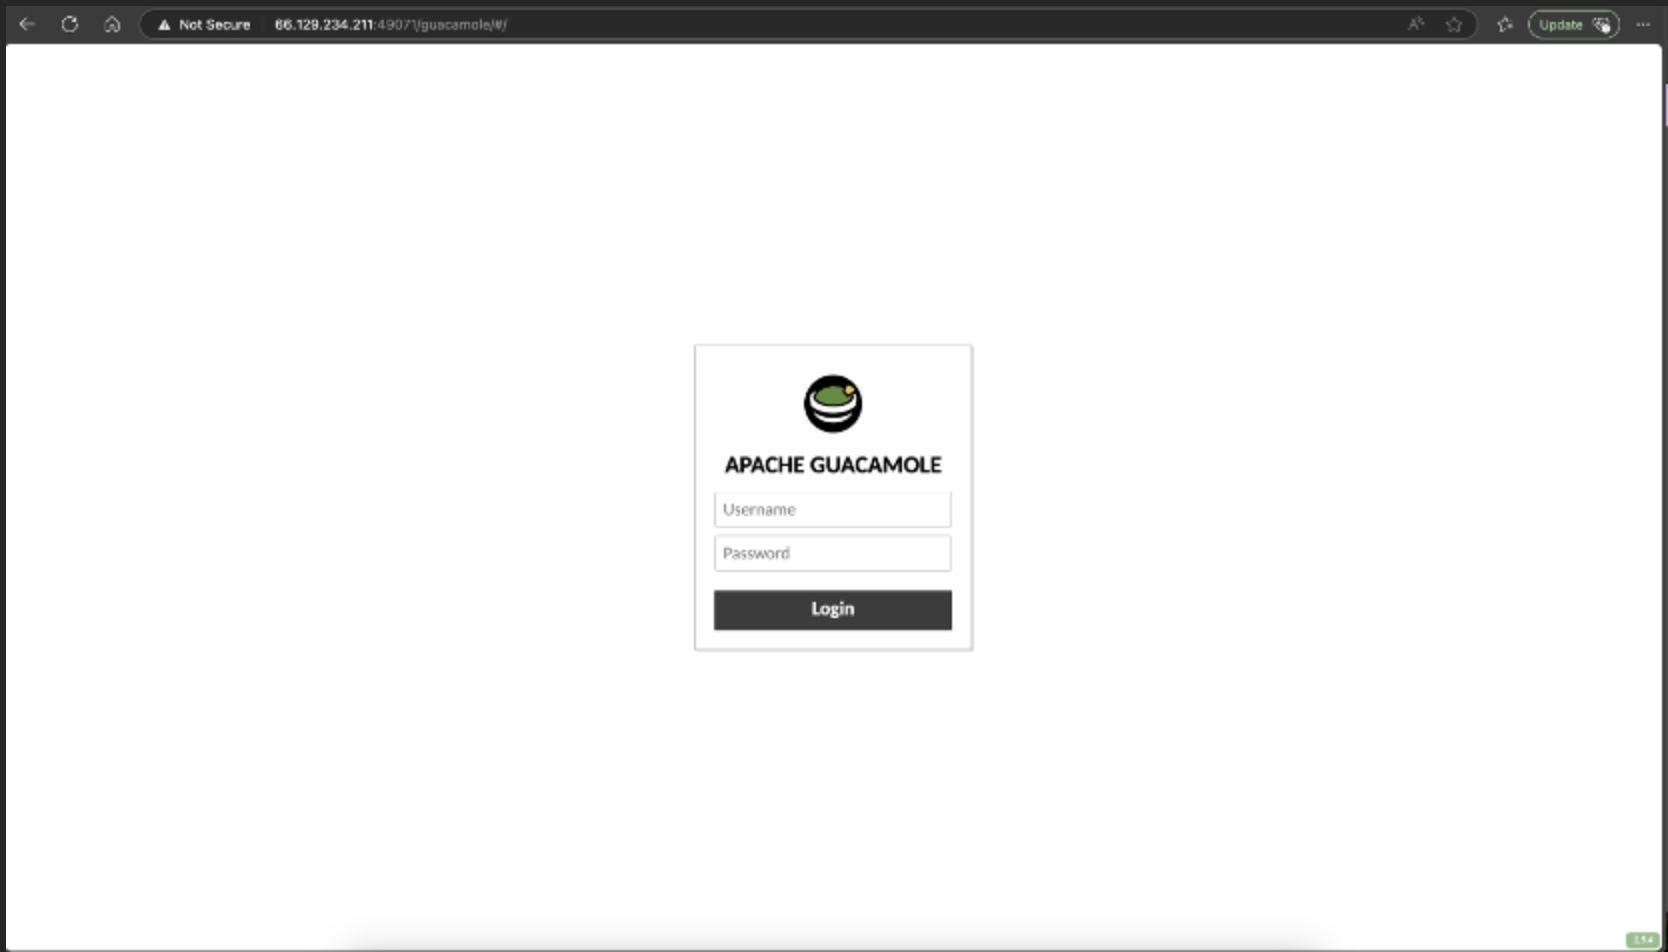
Access Helper VM via SSH from Windows Host using PuTTY. Click on Open.
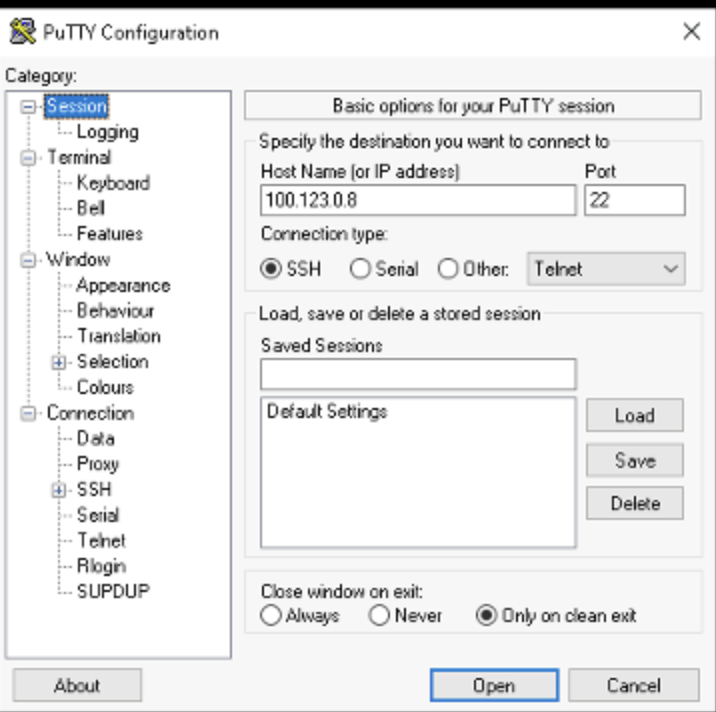
IP - 100.123.0.8
Username - labuser
Password - Juniper!1
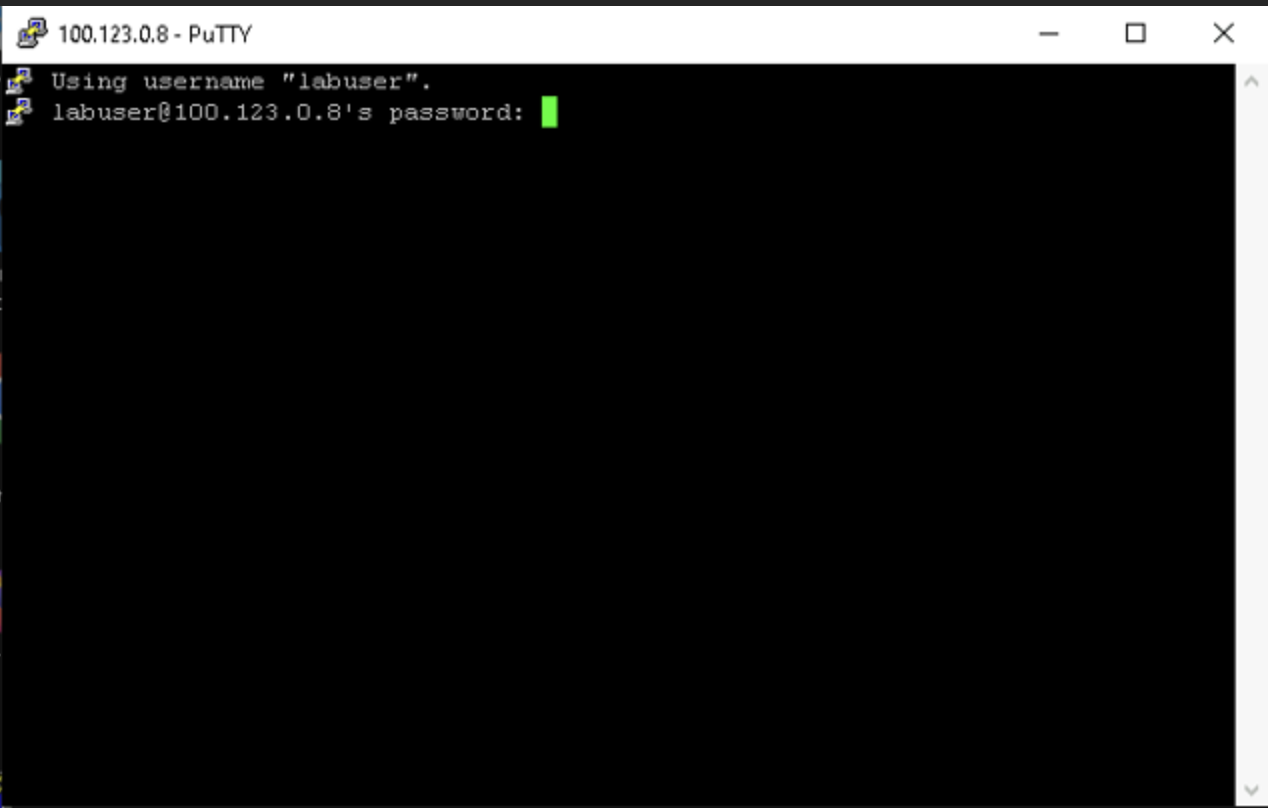
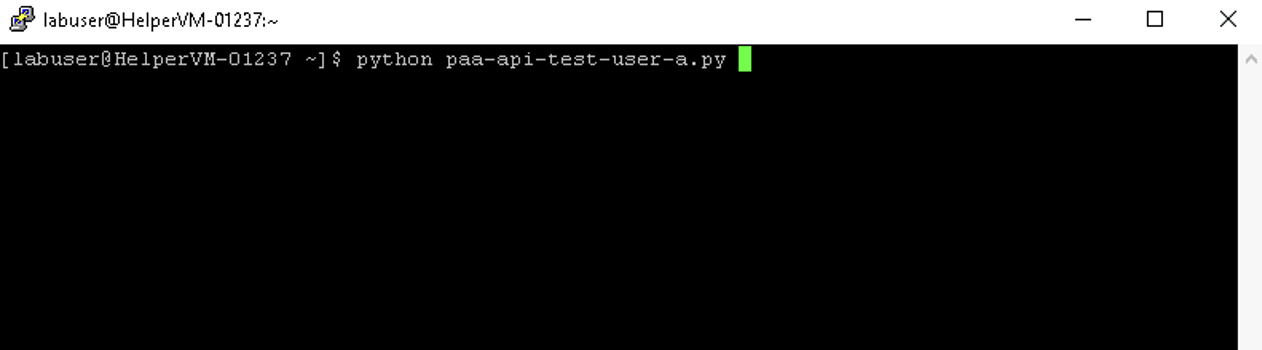
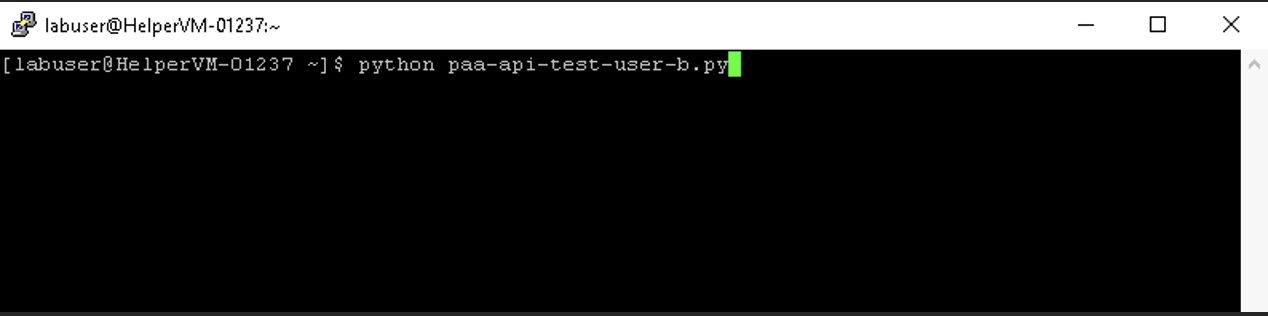
Execute script using command python3_paa-api-test-user- { }.py
{ } – to be filled as per allocation by the lab instructor. a to f – whichever roll is allocated to you.
For example, for a participant allocated {a}
For example, for a participant allocated {b}

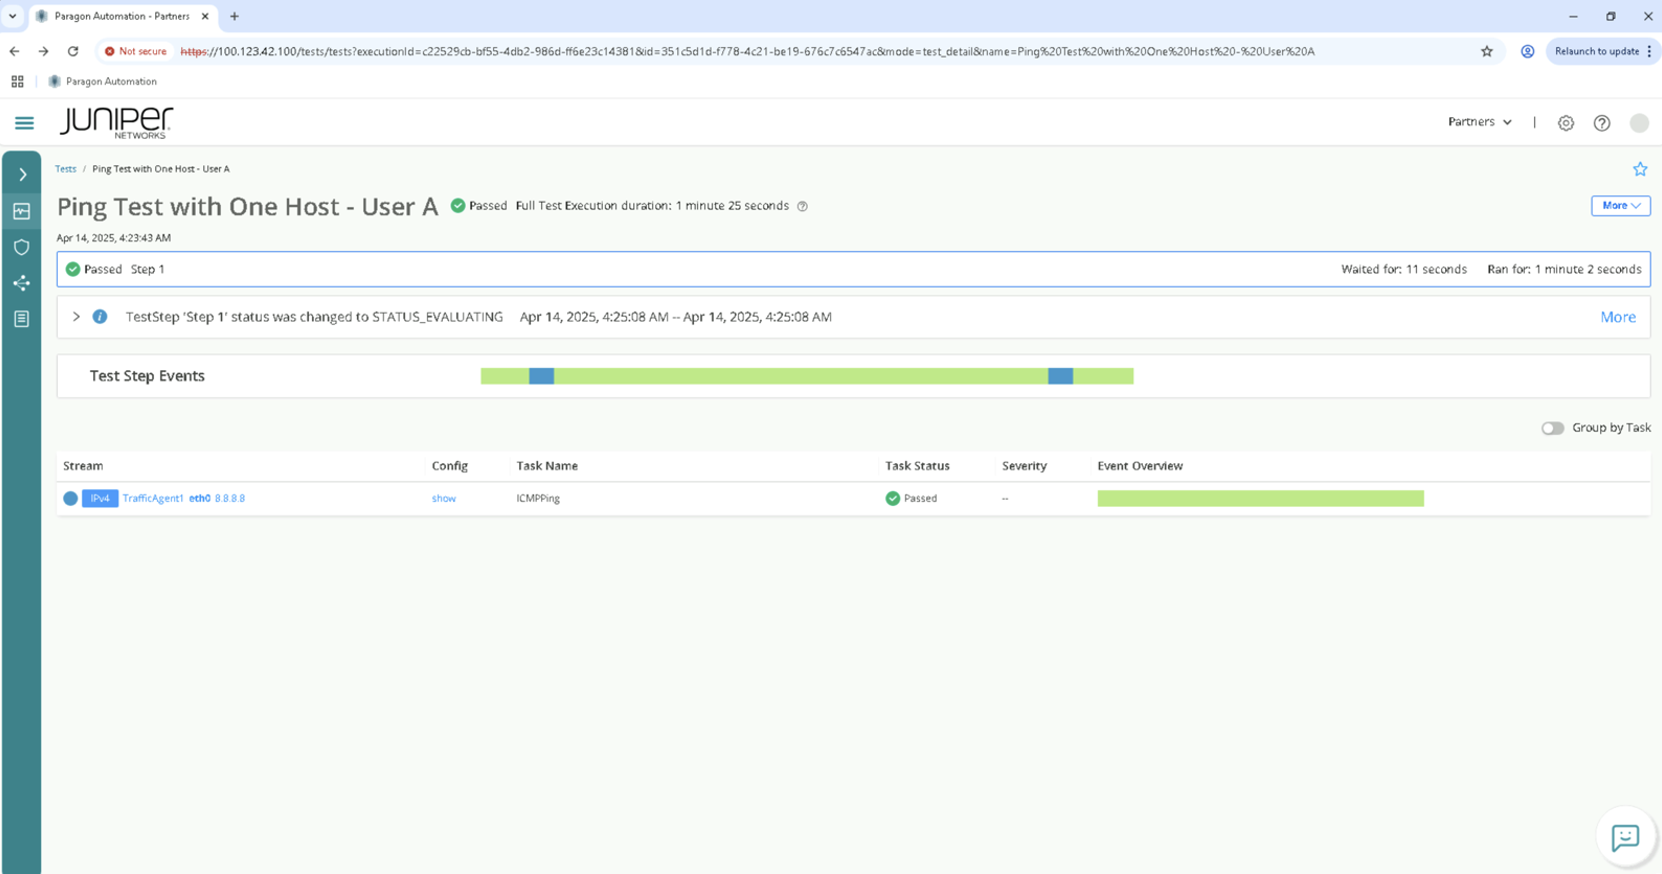
Check execution of tests from Paragon UI matching the roll {A to H}
Congratulations, you have completed the lab!
Visit https://portal.cloudlabs.juniper.net/ for many more labs and demos.
Lab Survey
Please take 2 minutes and complet the AWAN Paragon 2.0 Hands-On Lab Survey